AEROSCENT - Technology for Analyzing Natural Scents
Analysis Technology
We experience all sorts of scents in our living environments, such as fresh scents given off by flowers or herbs and natural scents in forests and on grasslands. We believe that these scents refresh us and provide peace of mind.
To precisely identify components emitted into the air by plants, Kao developed AEROSCENT, technology for analyzing natural scents. With this technology, which combines the chemical adsorption method and the canister method, we can quantitatively capture a wide variety of airborne constituents, ranging from highly volatile non-polar components to low-volatility, highly polar ones.

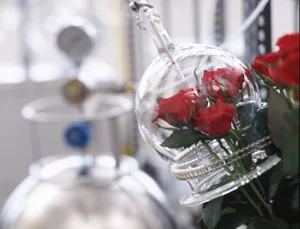
Aeroscent technology is applied for capturing scents given off by flowers
It is known that natural scents change (fluctuate) in quality or intensity with time, so we have also developed a technology for analyzing how natural scents change as time passes. This technology controls the flow of aroma-containing air and continuously keeps track of how natural scents fluctuate by using a number of collection tubes. The technology enables us to analyze the changes of natural scents with time and determine the time when they smell the best. For example, after a flower starts blooming, we can analyze how its scents change until it stops blooming, and how scents in a forest change from early in the morning until late at night.
Information obtained from research on natural scents greatly contributes to the development of new fragrances.
Aeroscent Technology
The following video does not include audio, and a text transcription of its visual content is available.
A transcript is available here.
- This video visualizes how the amounts of different aroma components given off by a rose change as it gradually blooms.
- The 30-second video shows the way a rose bud, shown around the center of the screen, gradually comes into full bloom.
- A bar graph on the right side of the screen shows the detected amounts of different aroma components as percentages of the respective maximum values.
- A line graph in the upper-right corner of the screen shows how the total detected amounts of all the aroma components change with time as percentages of the maximum value.
- All the components are emitted into the air in small amounts when blooming begins, but the amounts increase as the rose gradually blooms. Some components continue to increase while others fluctuate repeatedly after reaching the peak.
- Home
- Innovation
- Research & Development
- Fundamental Research
- Sensory Science
- AEROSCENT - Technology for Analyzing Natural Scents
- Home
- Innovation
- Research & Development
- Fundamental Research
- Sensory Science
- AEROSCENT - Technology for Analyzing Natural Scents
